


66% – A Sad (But True) Cleveland Statistic
On Thursday, November 29, FreshWater Cleveland distributed an article titled “2 out of 3 Clevelanders are functionally illiterate. So what are we doing about it?”
Some readers called the headline sensationalized, but at Seeds, we call it FACT.
“Here in Cleveland, 66 percent of the city’s adults are functionally illiterate. Pause there, and read that last sentence again,” reporter Ken Schneck urged readers.
Never Read the Comments? We Do
The readers did. And they commented. Functional illiteracy rates in Cleveland make people uncomfortable, and skeptical about the statistics. They find it difficult to believe this is an issue in their community.
Some readers believed “literacy” to exclusively mean “reading,” when it also includes numeracy, comprehension, and analytical skills. Others were incredulous that Seeds of Literacy had a few students who had actually graduated high school, but still had low literacy skills.
As the story quickly spread online — throughout Greater Cleveland and beyond — the veracity of the data was called into question, particularly the definition of “functional illiteracy” as an accurate description of the two lowest literacy levels (out of 5) described in the original study. The age of the study was also mentioned.
Welcoming the challenge and appreciating the attention to the issue, Dr. Carmine Stewart, Seeds of Literacy Program Director, reviewed all of the research from the study to provide clarity.
A Data Desert of Assumptions
Dr. Stewart found the following assumptions were being made in response to the research:
- Applying a 1997 research model to 2004 data assumes its variables have the same impact 7 years later. While the authors acknowledge this, not everyone who cites or reads the study does.
- Making correlations between dissimilar populations can be tricky; essentially, when you conduct a study on a nationally representative sample, comparing that sample to a dissimilar sample is like comparing apples to oranges. In other words, correlations that exist in some areas of the country may not hold true when looking at economically distressed areas.
- Saying “a high school diploma is associated with Level 2” assumes skills needed to obtain a high school diploma are the same nationwide, not taking into account the documented achievement gap in racially and socioeconomically diverse neighborhoods;
- The original studies were completed in 1997. Only portions of the study were updated in 2004. More recent data is not available. This underscores the need for more funding for studies of adult literacy levels.
Read Dr. Stewart’s full report: 66% The Source of the Statistic.
The Bottom Line
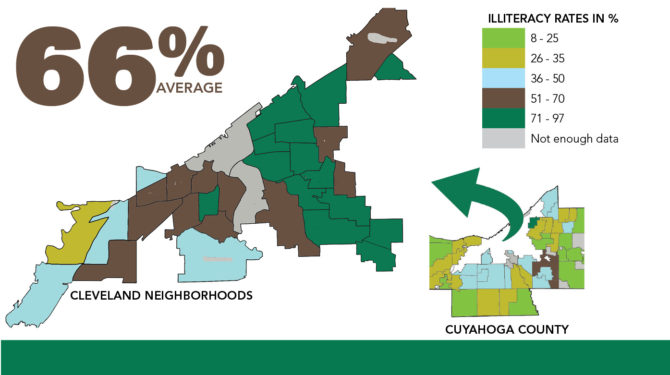
The 66% statistic is the absolute best estimate available based on the existing research. The even higher neighborhood estimates (some as high as 95%) hold true for students coming to Seeds, particularly at the Mt. Pleasant/Kinsman Seeds East location. [Statistical Data Cleveland Neighborhoods Handout]
At that location, students have scored at “tenth or eleventh grade levels” on the Test of Adult Basic Education (TABE) but cannot understand the passages they have read, can’t put those passages into their own words; many students can score well and still lack the foundational reading skills, such as using context clues, or even using phonics to sound out unfamiliar words.
Dr. Stewart welcomed the discussion with the skeptics because “It means we are FINALLY talking about something that has been a problem for a very long time.”
# # #
KLK
2 out of 3 Clevelanders are functionally illiterate. So what are we going to do about it? – FreshWater Cleveland, 11/29/2018
66% The Source of the Statistic – Dr. Carmine Stewart
Assessing Literacy Needs in Cuyahoga County – Center for Urban Poverty and Social Change, Mandel School of Applied Social Sciences, Case Western Reserve University, 2004
Statistical Data Cleveland Neighborhoods Handout
National Assessment of Adult Literacy — Key Findings
Survey of Adult Skills – International study from the Programme for the International Assessment of Adult Competencies